2026-11-05 A WebSocket-based Bloomberg Terminal Clone
Pissing off techbros and fintwt in one go
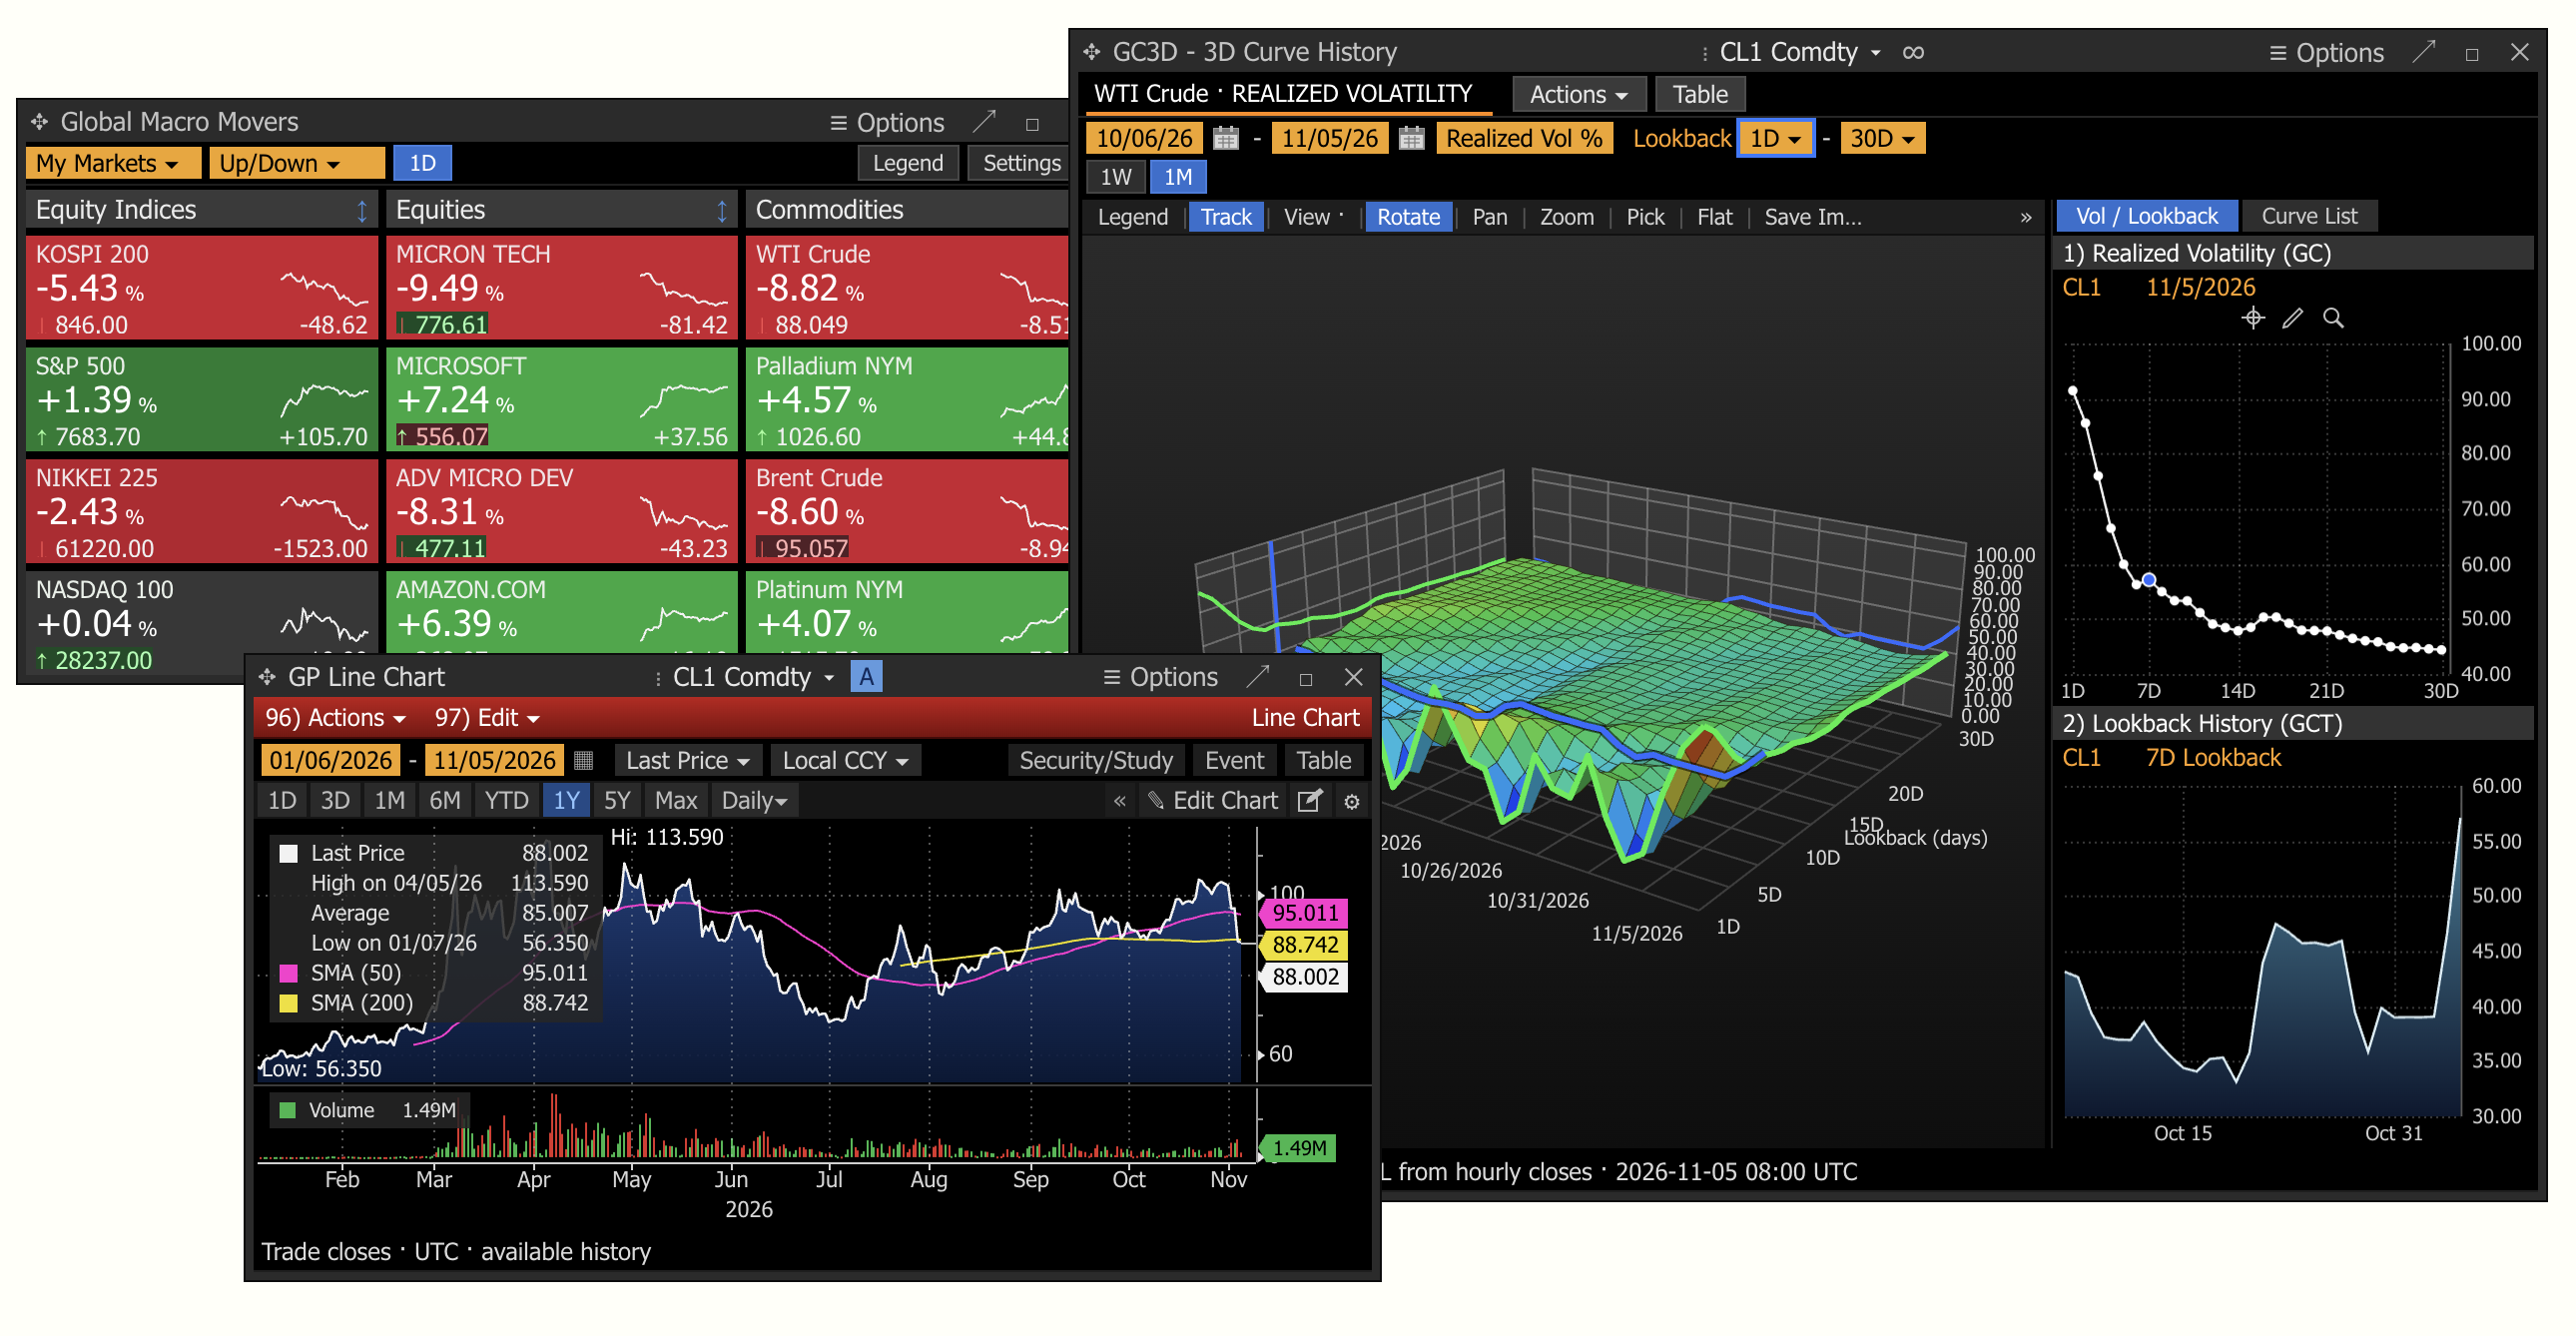

Xitterites (formerly Twitter) are terminally obsessed with replicating (vibecoding) a Bloomberg Terminal alternative, as they see it as one of the pieces of software that deserves it. I guess there is a certain jealousy seeing fintwt constantly making witty points attached to terminal screenshots and getting thousands of RTs from it. So i of course decided to throw my hat in the ring with a very stupid, complicated, over-engineered solution, that serves no purpose other than to flex.
If you’ve refreshed the front page enough times, you’ve probably seen the Bloomberg Terminal windows in the site greeting you. You can drag them around, open a price chart, and rotate the oil volatility surface. The numbers update live despite this being a Hugo-based static website, so where is the data actually coming from?
The homepage connects directly to the Hyperliquid public API and displays perpetual contract prices inside a terminal interface. There is no market-data server behind this website as Hugo builds the pages, the browser opens a WebSocket, and some JavaScript turns the incoming quotes into the sort of screen that makes you look like a busy intern slaving away on the floor of a BB.
Why Hyperliquid?
I’m never a crypto guy, but Hyperliquid is probably the most exciting implementations of crypto for trading ever created. Hyperliquid primarily functions as a venue for trading perpetual futures (derivative contracts with no expiration date) as well as spot markets for crypto, commodities, and synthetic traditional assets like the S&P 500. Traders execute orders directly from their own crypto wallets without handing over custody of their funds to a centralized company, powered by custom consensus technology (HyperBFT) that achieves sub-second settlement and high throughput (200,000+ orders per second).
What benefits this project the most is Hyperliquid’s WebSocket API, which allows you to stream low-latency, real-time market and account data directly from the exchange for free. Whats better is that for pure data collection use cases (such as ingesting public feeds like order books, trades, and asset contexts), Hyperliquid does not enforce a standard request-per-minute rate limit on incoming data packets from the server. Instead, the rate limits are strictly enforced on your connection behavior and inbound subscription requests to prevent denial-of-service on the public gateway. This means we get a free, low-latency, futures contract datapoint (albeit with some deviation from actual live markets, but this issue will be discussed later).
The terminal windows
The desk opens three components. GMM is the Global Macro Movers board, with tiles for equity indices, equities, and commodities. GP is the price chart in front. GC3D is the larger window showing the oil volatility surface and its linked curves. Most of the terminal appearance is ordinary HTML and CSS: compact typography, orange fields, tightly packed controls, and overlapping windows. The price charts use Canvas. The little sparklines in the movers board use SVG, which avoids creating a separate canvas for every tile.
The 3D surface also uses a 2D canvas. The renderer projects a grid into screen coordinates, sorts its quads by depth, and paints them from back to front. Rotation changes the camera angles, zoom and pan change the projection.
function project(x, y, z) {
  var xr = x * cosY - y * sinY, yr = x * sinY + y * cosY, zc = z - H * 0.45;
  var depth = yr * cosP - zc * sinP, ps = 1 / (1 + depth * o.persp);
  return [cx + xr * sc * ps, cy - (zc * cosP + yr * sinP) * sc * ps, depth];
}
The underlying surface contains up to 31 observation dates and 30 lookback periods. The window manager handles dragging, resizing, focus, and opening another component when you select a security. On this site, selecting the WTI tile opens GC3D, while the other market tiles open a GP price chart. The data reaches those components through several processing layers, as illustrated below :
Getting the prices
The first request is an HTTP POST to Hyperliquid’s /info endpoint:
const response = await fetch('https://api.hyperliquid.xyz/info', {
  method: 'POST',
  headers: { 'Content-Type': 'application/json' },
  body: JSON.stringify({ type: 'metaAndAssetCtxs', dex: 'xyz' })
});

if (!response.ok) throw new Error('Market snapshot unavailable');
const [metadata, contexts] = await response.json();
This selects the xyz perp venue, which has a response that contains a universe of contracts and a corresponding array of market contexts, including mark price, previous-day price, funding, and open interest.1 The feed joins the two arrays by index, keeps the contracts in its catalog, and excludes delisted entries. Of course just because a contract has a name in the catalog doesn’t mean it’s a live instrument. The catalog entry only tells us how to display that contract if the API lists it, it doesn’t make the contract available. What actually shows up on the board is decided by the current metadata.
After discovery, the browser connects to wss://api.hyperliquid.xyz/ws and subscribes to each selected contract’s asset context, plus one fastAssetCtxs stream on the same connection when the browser supports raw DEFLATE. An individual asset-context subscription looks like this:
{
  "method": "subscribe",
  "subscription": {
    "type": "activeAssetCtx",
    "coin": "xyz:CL"
  }
}
The fast stream carries compressed mark-price deltas; omitted fields retain their existing values, and midpoint-only updates never replace a mark. Standard activeAssetCtx messages supply the previous-day reference and other context, and remain the fallback.2
send('subscribe', { type: 'fastAssetCtxs' });

async function fastContexts(raw) {
  if (typeof raw !== 'string') throw new Error('Invalid fast asset context');
  var binary = atob(raw), bytes = Uint8Array.from(binary, function (c) { return c.charCodeAt(0); });
  var stream = new Blob([bytes]).stream().pipeThrough(new DecompressionStream('deflate-raw'));
  return new Response(stream).json();
}
The feed validates the mark, updates the quote timestamp, and calculates the percentage move:
function number(value) {
  if (value == null || value === '' || typeof value === 'boolean') return null;
  var n = Number(value); return Number.isFinite(n) ? n : null;
}

var mark = number(ctx.markPx), prev = number(ctx.prevDayPx);
if (mark == null || mark <= 0) return false;
market.prev = prev != null && prev > 0 ? prev : null;
market.move = market.prev == null ? null : (mark / market.prev - 1) * 100;
From those values, we can set the tile’s percentage of asset price movement and background color (green or red). The board sorts contracts by how big their moves are, and in mixed mode it alternates gainers and decliners when it has both. The adapter copies the quote into the terminal’s security object and batches live tick events into the next animation frame. Components listen for that event and redraw, including each sparkline when its mark changes. That way the chart code doesn’t have to deal with WebSocket parsing.
var liveFrame = null, surfaceUpdates = new Set();
function liveTick() {
  if (liveFrame != null) return;
  liveFrame = requestAnimationFrame(function () {
    liveFrame = null;
    surfaceUpdates.forEach(function (s) { updateSurface(s); }); surfaceUpdates.clear();
    mkt.emit('tick', ++mkt.tickNo);
  });
}
Then we convert all the names into names that are more familiar to Bloomberg Terminal users, as Hyperliquid has their own asset naming conventions :
| API identifier | Display identifier |
|---|---|
xyz:CL | CL1 Comdty |
xyz:GOLD | GC1 Comdty |
xyz:SP500 | SPX Index |
xyz:NVDA | NVDA US Equity |
These are only for display purposes, as every request still uses the actual Hyperliquid identifier. The price under CL1 Comdty is the mark of the xyz:CL perpetual; it is not a quote for the front-month NYMEX futures contract. The idea is that as Hyperliquid gains more widespread institutional usage the prices displayed here might actually start to more closely track real various commodity and security future contracts.
Opening a WebSocket connection is easy, but deciding whether its last message is still usable takes a bit of work. Each quote carries a receipt timestamp; after 45 s without a valid update it is stale. The market filter excludes stale quotes, unlisted contracts, and quotes lacking a usable previous-day price. Live status requires recent valid asset-context data. If streaming fails, HTTP snapshots refresh the display about every 30 s and during healthy streaming, metadata refreshes periodically to catch listing changes. Failed requests retain last-known prices, which still age out of the fresh set.
var streaming = socket && socket.readyState === 1 && lastWs && now - lastWs < STALE;
if (now - requestedAt > 30000 && (!streaming || now - snapshotAt > 300000)) {
  refresh().then(connect);
}
if (socket && now - (lastWs || openedAt) > STALE) socket.close();
Reconnects use exponential backoff from 1 s to 30 s (the client pings about every 20 s and closes connections that go too long without usable quote data) then reconnects. The page queues outgoing messages at a maximum of 20 per second and caps new connection attempts at 20 per minute, below Hyperliquid’s published limits, other tabs and apps still share the per-IP budget.3 Snapshot requests time out so one hung request cannot block later refreshes. A request can complete after the feed stops (for example, tab hidden, request aborted, old continuation runs during restart) and a generation counter rejects results from earlier runs; per-contract message sequence guards also prevent a delayed fast-stream decode from overwriting a newer quote.
Loading the price history
The GP window loads candles separately through candleSnapshot:
const now = Date.now();
const request = {
  type: 'candleSnapshot',
  req: {
    coin: 'xyz:CL',
    interval: '5m',
    startTime: now - 3 * 86400000,
    endTime: now
  }
};
GP opens in the YTD view by default, using daily candles whose current close updates as streamed messages arrive. Its legend shows last price, high, average, low, and 50/200-period SMAs calculated from the selected candle interval. The 1D and 3D views use five-minute candles. The adapter requests both independently, so either chart can paint without waiting for the other. Selecting a contract starts five-minute and daily candle subscriptions, shared by asset and interval until the last chart watching them closes, so opening another GP does not stop the first chart’s updates.
function onCandle(coin, point, interval) {
  var s = mkt.get(coin); if (!s) return;
  var key = interval === '1d' ? 'dayBars' : interval === '1h' ? 'surfaceBars' : 'bars';
  var pending = interval === '1d' ? s.pendingDayBars : interval === '1h' ? s.pendingSurfaceBars : s.pendingBars;
  if (pending) pending.set(point.t, point);
  s[key] = mergeBars(s[key] || [], new Map([[point.t, point]]));
  var days = interval === '1d' ? 1826 : interval === '1h' ? 64 : 3;
  s[key] = s[key].filter(function (p) { return p.t >= Date.now() - days * 86400000; });
  var now = Date.now(), completed = point.t + 3600000 <= now;
  var nextHour = s.surface && s.surface.through < Math.floor(now / 3600000) * 3600000;
  if (interval === '1h' && (completed || nextHour)) surfaceUpdates.add(s);
  liveTick();
}
Messages can arrive while the initial HTTP history request is still in flight. To avoid losing them when the snapshot finishes, the adapter buffers pending updates in a map keyed by candle timestamp and merges them with the downloaded bars. An existing timestamp replaces that candle. The tiles display perpetual mark prices, while the price charts use trade candles, including their developing close, and the volatility calculation uses completed hourly closes. Those values can differ because they represent different price observations.
function mergeBars(rows, updates) {
  var bars = new Map(rows.map(function (p) { return [p.t, p]; }));
  if (updates) updates.forEach(function (p, t) { bars.set(t, p); });
  return Array.from(bars.values()).sort(function (a, b) { return a.t - b.t; });
}
Range buttons select from the history the API actually returns, this means a 5Y button does not imply a recently listed contract has five years of data. Hyperliquid also limits candle snapshots to the most recent 5,000 candles.4 Empty or short history stays empty or short. The movers board issues smaller requests for 24-hour sparklines, limited to three concurrent requests and started for visible tiles. Before history arrives, a tile can use marks observed during the current session. Those observations are sampled at most once every five seconds and capped at 40 values, so they are only a short trace and do not establish pre-open behavior.
Volatility Surface Calculation
The GC3D window plots realized volatility across observation dates and lookback periods, measured from variation in hourly candle-close returns. An implied-volatility surface would need option prices and axes such as strike and expiry. The data here does not supply that, so labelling a generated mesh with strikes would make a nice picture, but no option market would sit behind it. So instead, I plotted realized volatility from the perpetual’s hourly trade candles. Hourly candles also stream over WebSocket, so completed-hour updates trigger recalculation without waiting for the HTTP fallback. This measures historical price variation, which is abit different from options-implied volatility.
var HOUR = 3600000;
var unique = new Map();
bars.forEach(function (p) {
  if (Number.isFinite(p.t) && Number.isFinite(p.c) && p.c > 0 && p.t + HOUR <= now) unique.set(p.t, p);
});
var data = Array.from(unique.values()).sort(function (a, b) { return a.t - b.t; });
var start = data.length - 1;
while (start > 0 && data[start].t - data[start - 1].t === HOUR) start--;
data = data.slice(Math.max(0, start));
if (data.length < 31 * 24 + 1) throw new Error('At least 31 days of continuous hourly closes are required');
For completed hourly closes \(P_t\), calculate the log return:
\[ r_t = \log\left(\frac{P_t}{P_{t-1}}\right). \]For a lookback of \(d\) days, the window contains \(n = 24d\) hourly returns. The displayed volatility is their sample standard deviation, annualized using calendar hours and expressed as a percentage:
\[ \widehat{\sigma}_{d,t} = 100\sqrt{365\cdot24} \sqrt{\frac{1}{n-1}\sum_{k=t-n+1}^{t}(r_k-\bar r)^2}. \]The 365 × 24 factor is the convention chosen for this continuous hourly series. The implementation precomputes prefix sums of returns and squared returns. Any window can then be evaluated using two differences:
var sum = [0], sum2 = [0];
for (var k = 1; k < data.length; k++) {
  var r = Math.log(data[k].c / data[k - 1].c);
  sum[k] = sum[k - 1] + r; sum2[k] = sum2[k - 1] + r * r;
}

const s = sum[end] - sum[end - n];
const ss = sum2[end] - sum2[end - n];
const variance = Math.max(0, (ss - s * s / n) / (n - 1));
const vol = Math.sqrt(variance * 365 * 24) * 100;
The variance calculation subtracts two nearly equal quantities (\(\sum r_i^2\) and \((\sum r_i)^2/n\)) making it susceptible to catastrophic cancellation when returns have very little variation. But rounding in IEEE 754 double-precision arithmetic can leave a slightly negative residual despite variance being mathematically nonnegative. So we use Math.max(0, ...) to clamp that residual to zero before taking the square root, preventing NaN values from propagating into the volatility surface.
We repeat this for lookbacks of 1 to 30 days across up to 31 observation dates to get the surface height grid. Dates are spaced one day apart and end at the latest completed hour in the data. As the linked curves slice the same grid, moving the selection ties the 3D display to a date and lookback.
Why do this?
I was bored and i wanted to flex. That’s all.
 ₕₐₘₚₜₒₙ@hamptonism
Perplexity just became the the first Al company to truly go head-to-head with the Bloomberg Terminal... Using Perplexity Computer (with no local setup or single LLM limitation), it was able to build me a terminal with real-time data to analyze $NVDA using Perplexity Finance:
On a more serious note, i think many people just see the fancy charts, tickers, and BFW functions in the fintwt bloomie screenshotters and think thats all the moat a Bloomberg Terminal has. This exercise demonstrate that the terminal has other analysis tools that are quite hard to replicate with only partial data available via public sources, even as platforms have popped out to democratize securities trading and provide high-fidelity market data. There is also the social aspect of Bloomberg Terminal that traders ignore, because at scale being outside of the finance loop costs alot of money (and connections).
Another is the importance in detecting and fixing errors in the data, i personally have been in positions as an intern cleaning Bloomberg historical futures data. Free or cheap data providers have no revenue incentive to fix errors and no QA pipelines to catch them, some of them also sell your data to people across from you in the street. If something is free, most likely you’re the product.
Hyperliquid’s perpetuals info endpoint documentation describes
metaAndAssetCtxs, thedexparameter, and the returned metadata and asset contexts. ↩︎Hyperliquid’s WebSocket subscription documentation specifies
activeAssetCtx, the compressedfastAssetCtxssnapshot and deltas, and the separatecandlesubscription. ↩︎Hyperliquid’s rate limits documentation lists per-IP WebSocket limits, including 2,000 messages sent per minute and 30 new connections per minute. ↩︎
The candle snapshot documentation specifies the request fields, supported intervals, venue-prefixed HIP-3 identifiers, and the 5,000-candle history limit. ↩︎